
Precision Fish Detection (PFD) Analysis
Your numbers can look right — while your stock is already wrong.
Precision Fish Detection (PFD) reveals hidden stock discrepancies, validates biomass assumptions, and protects your feeding decisions before small errors become major losses.
👉 Start Analysis: Emergent | Fullstack App
👉 Upload Your Data: Emergent | Fullstack App
The Problem
In aquaculture, everything depends on one assumption:
How many fish are actually in the cage.
But in reality:
Fish are lost without being recorded
Sampling errors distort average weight
Feeding appears efficient when it isn’t
Biomass calculations drift from reality
The dangerous part is that the data can still look correct.
Lower biomass can artificially improve FCR.
Growth can appear stronger than expected.
Feeding can seem optimal.
But the system is misleading you.
What is PFD Analysis?
Precision Fish Detection (PFD) is a decision-support system designed to detect, validate, and quantify hidden stock discrepancies using real production data.
It does not just show trends.
It answers the critical question:
“Do I actually have the number of fish I think I have?”
How It Works
PFD combines multiple analytical approaches to build a reliable picture of stock reality:
FCR-Based Detection
Compares observed biological FCR against validated models to identify when fewer or more fish are consuming the feed.
Growth vs Model Analysis
Tracks actual growth against biological expectations to detect deviations and identify misleading performance signals.
Sample Jump Detection
Identifies sudden increases in average weight that indicate likely fish loss between sampling events.
Growth-Fit Modelling
Calculates the fish count that best fits the observed growth trajectory across the production cycle.
What Makes PFD Different
Most systems stop at data.
PFD validates the data itself.
Precision Detection
Identifies stock discrepancies even when performance appears normal.
Multi-Layer Validation
No single signal is trusted in isolation. Results are cross-checked across growth, feed, and sampling behaviour.
Confidence-Based Outputs
Every result is classified:
Signal (early indication)
Evidence (validated trend)
Decision (actionable)
This prevents false certainty and reduces the risk of incorrect decisions.
Financial Impact Visibility
Quantifies the cost of incorrect stock assumptions, including wasted feed and distorted performance metrics.
What You Can Detect
Hidden missing fish
Overestimated or underestimated biomass
False “good” FCR caused by stock loss
Feeding inefficiencies linked to incorrect fish count
Sampling errors and inconsistencies
Growth suppression versus stock-related distortions
Why It Matters
Feed is your largest cost, and every feeding decision depends on biomass accuracy.
If your stock number is wrong:
You are feeding incorrectly
Your FCR is misleading
Your forecasts are unreliable
PFD ensures:
Feed is allocated to the fish that are actually present
Growth performance is interpreted correctly
Decisions are based on validated data, not assumptions
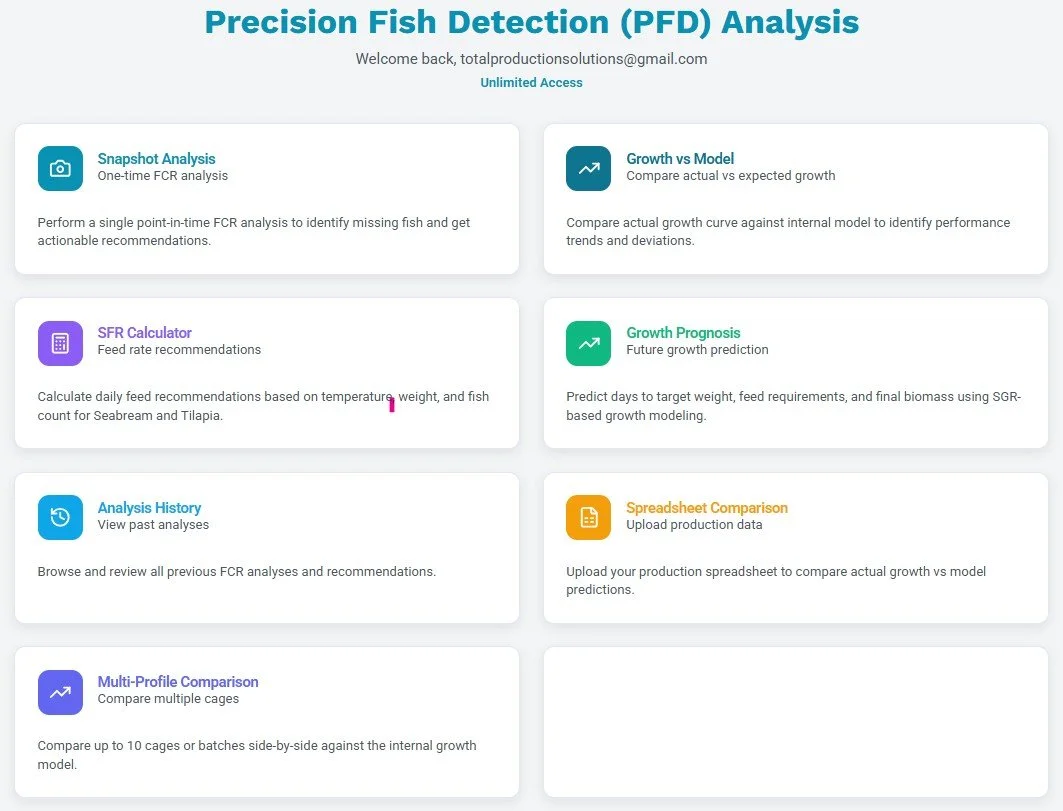
How to Use PFD
Snapshot Analysis
A quick FCR-based check for early detection of discrepancies.
Growth vs Model
Understand performance trends and identify when deviations occur.
Spreadsheet Upload
Full validation using production data across multiple parameters.
Growth Prognosis
Forecast future performance using corrected stock assumptions.
Learn How to Use Each Tool
Snapshot Analysis
https://youtu.be/cgs0HofQ1nk
SFR Calculator
https://www.youtube.com/watch?v=yC5JeI5GVws
Growth Model Analysis
https://youtu.be/NpQnmmeabF4
Growth Prognosis
https://youtu.be/BkY9MLpjop4
Spreadsheet Comparison
https://youtu.be/hFtu4G_AC6c
Custom Model Upload
https://youtu.be/aXQ9JEGTID4
Multi-Profile Comparison
https://youtu.be/OPjeDV5cUaM
Built for Real Operations
PFD is designed for:
Production managers
Farm operators
Technical directors
Data-driven aquaculture teams
It works with existing farm data and integrates into current workflows without complexity.
The Outcome
With PFD, you gain:
Confidence in stock numbers
Accurate feeding strategies
Early detection of loss events
Reliable production forecasts
Improved cost control and margin protection
Take Control of Your Data
Stop relying on unvalidated assumptions.
Upload your data and understand what is really happening inside your cages.